

Quick Answer: Vanity metrics — follower count, impressions, page views measure reach, not relationship. To track real community engagement, use behavioral metrics instead: repeat attendance, RSVP-to-attendance rate, referral rate, and 90-day member retention. These event metrics predict outcomes; reach metrics only predict visibility.
10,000 followers mean very little if 20 people show up. Follower count tells you how many people are watching. It doesn’t tell you how many care enough to participate, return, or bring someone with them and that’s where real community growth actually shows up.
This is a reference for closing that gap: which numbers should actually change what you do next, and which ones just look good in a slide.
A vanity metric is a real number that doesn’t require anyone to have done anything. Follower count moves when someone taps a button once. It says nothing about whether they came back, participated, or would notice if you disappeared.
Keep two labeled buckets. Reach metrics show how many people could see or hear from you — followers, impressions, email list size. Relationship metrics show whether those people actually did something — RSVP, came back, replied, referred someone. A growing follower count is good news about visibility. It isn’t proof of engagement unless a behavior backs it up.
Reach metrics vs. relationship metrics
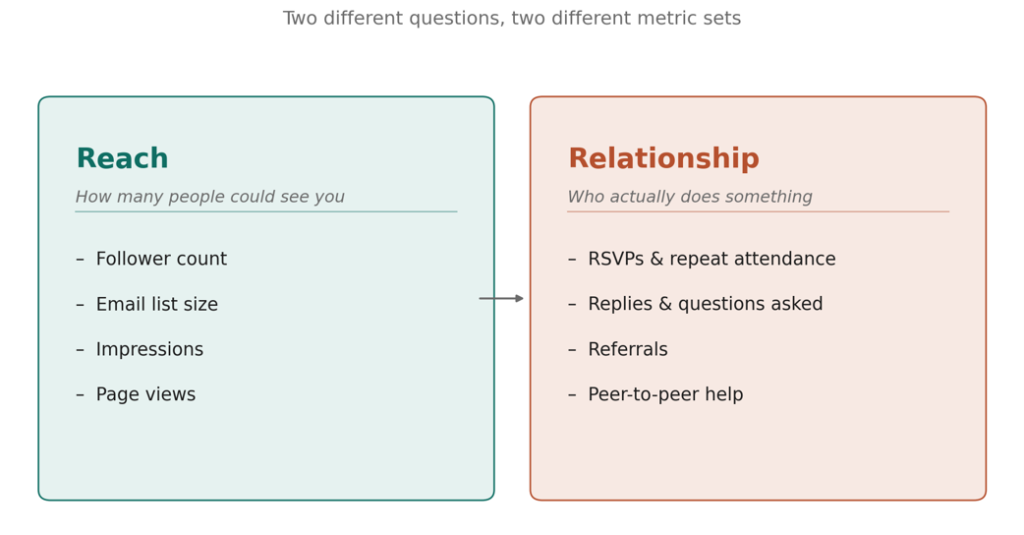
Behavior is a better predictor of value than audience size. A large, passive following does nothing for your community or event a small group that keeps showing up usually does. You can grow an audience to tens of thousands and have almost no one who’d notice if the next event didn’t happen.
A six-week-old community and a two-year-old one shouldn’t be judged by the same numbers. Early on, activation matters most are new people doing anything at all. Later, depth matters most repeat attendance, peer-to-peer help, members bringing others in. Expecting a retention number from something that launched last month sets an expectation nobody can meet yet.
A number rarely convinces anyone on its own. A member who kept coming back, a thread where a stranger got a real answer, a first-timer who showed up because a friend brought them pairing the number with a specific example is what makes it land with stakeholders.
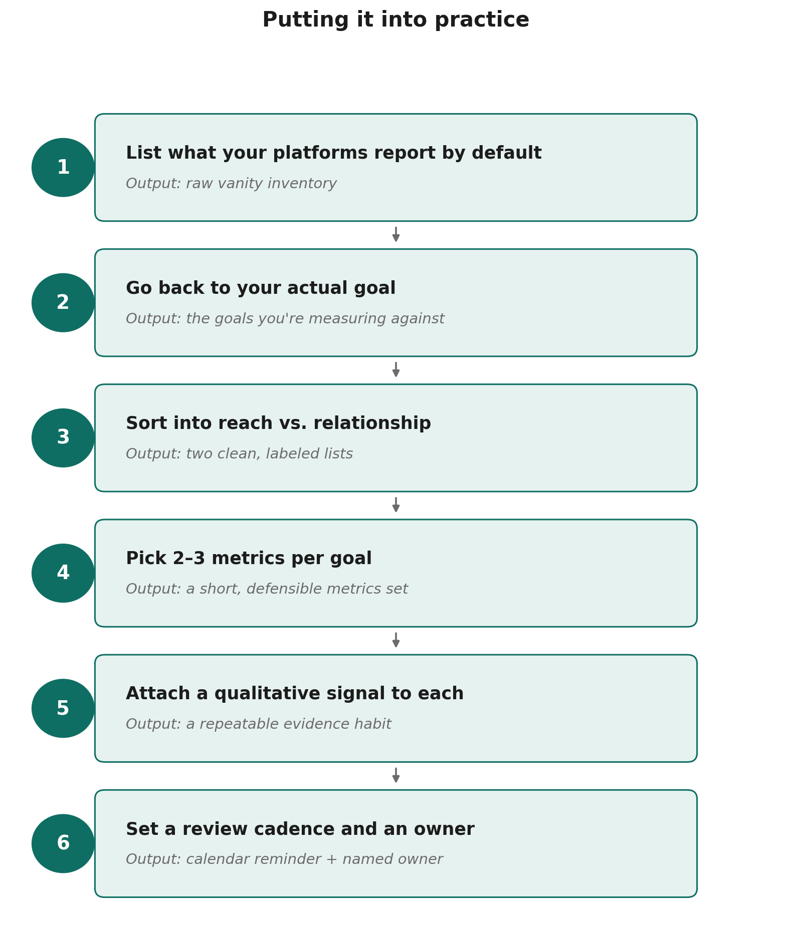
The six-step process, start to finish
| Planning element | Example output |
| Community goal | Increase repeat attendance at monthly events |
| Reach metric | Follower count / email list size |
| Relationship metric | % of attendees who RSVP to a second event within 60 days |
| Qualitative signal | Post-event survey quotes on what made someone come back |
| Review cadence | Monthly internal check, quarterly stakeholder review |
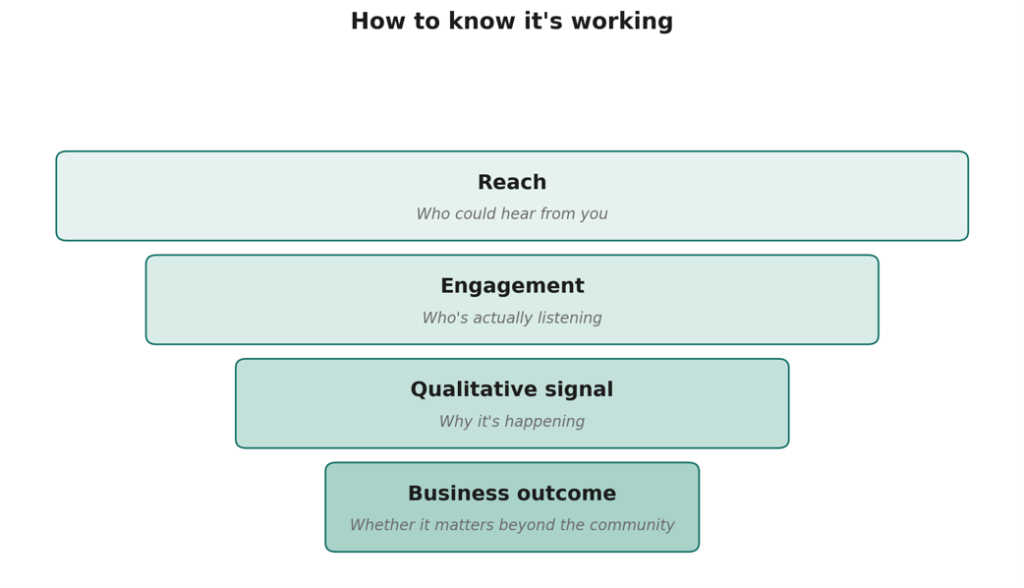
Reach tells you how many people could hear from you. Engagement tells you who’s actually listening. Qualitative signals tell you why. Business outcomes tell you whether it matters beyond the community though directional correlation, not clean attribution, is usually the most honest claim available.
Four layers, each answering a different question
Knowing what to measure is one thing. Tracking it consistently is another.
Pinch brings the operational side of community and event management into one place- events, RSVP, attendance, feedback, and member activity — so organizers spend less time piecing together numbers from different tools and more time acting on what those numbers show.
Instead of asking “how many followers did we gain this month?”, that shift moves the focus to:
The goal isn’t a bigger dashboard. It’s having the right signals in front of you when you need to decide what to do next.
Isn’t follower count still useful for anything?
Yes — for reach and discover ability. It just isn’t evidence that anyone is engaged, and it shouldn’t be your primary success metric.
How many metrics should we actually track?
Fewer than you think. Three or four metrics reviewed monthly beat fifteen sitting untouched in a dashboard.
What if we don’t have behavioral data yet?
Start manual. A tagged spreadsheet of who showed up twice beats waiting months for a perfect automated system.
When should we revisit our metrics?
Whenever your goals shift, and on a regular cadence beyond that quarterly works for most teams.